CORTICAL PERIMETER
Short Info
Risto Näsänen and Antti Raninen
● By the 'CorticalPerimeter' application, you can evaluate contrast sensitivity of the visual field using ordinary computer displays. Contrast sensitivity refers to the ability to see low contrasts, i.e., small differences in brightness. Contrast sensitivity refers to the ability to see low contrasts, i.e. small differences in brightness.
● If a sufficiently large display and short viewing distance are used, a full 30-deg-field can be measured. Alternatively, the measurement can be limited to a smaller area around the fovea, e.g., the macula area.
● In addition, it is also possible to evaluate the Letter Contrast Sensitivity Function (LCSF) of central vision.
● Further, by using the Training mode, residual vision can be trained at defective visual field locations.
Visual field testing — key features
Fast perimetry mode. The application combines four adjacent measurement points on the visual field, which increases the measurement speed. The speed increase, however, leads to a reduction of spatial accuracy.
Medium speed perimetry mode. The application estimates each measurement point independently.
Detection task. The observer is required to indicate whether she/he has seen a static or flickering ring by pressing the space bar on the keyboard. Observer's response criterion is controlled using catch trials.
Identification task. The task of the observer is to indicate the identity of a static or flickering letter by clicking a button marked by that letter. If the observer feels her/himself completely uncertain about the target identity, she/he should guess the most likely letter. If the observer categorically refuses to do that, she/he can press the Next button. The application interprets this as a wrong response.
Stimulus properties. All stimuli have a 1.5 octave spatial frequency pass-band with a centre frequency equal to 3 c/object width and height. This pass-band is in many cases the most important one in human letter identification (Solomon and Pelli, Nature 369, 395–397, 1994). In the visual field test, the stimulus presentation duration is 168 ms. When flicker is used, its rate is ≈12 Hz
Letter stimuli are filtered Sloan or Sloan-like letters: A, B, D, H, K, N, O, R, S, U, V, and Z. The ring stimulus is the same as the filtered Sloan letter O.
The measurement can be done using different combinations of stimuli and tasks: Detection of static rings, Detection of flickering rings, Identification of static letters, or Identification of flickering letters.
Size scaling of stimuli. In visual field measurement, stimulus size increases with eccentricity to obtain a roughly equal sensitivity across the visual field, if the field is healthy. Eccentricity is the off-centre (sideward) angular distance from the fixation point. Fixation point is the point on the screen that is viewed directly and that stimulates the fovea on the retina.
Importantly, any significant deviation from equal sensitivity across the visual field suggests a problem in visual processing. This is why, the intact part of the visual field, e.g., the other half-field, can serve as a normal value to which a part with lower sensitivity can be compared.
Central vision may have a slightly lower sensitivity than peripheral vision due to possible suboptimal optical correction of the eye, which mainly affects the visibility of small objects at central vision.
Algorithm. The algorithm employed - a variant of the stochastic approximation method (Robbins and Monro, Ann. Math. Statist. 22, 3 (1951), 400-407.) - searches for threshold contrasts at up to 73 points in the visual field in parallel. In the training Mode, the algorith is the Stair case method (Wetherill & Levitt,1965), however. Target contrast changes depending on the responses given by the observer. The data are displayed both graphically as a contrast sensitivity map and as alphanumerically.
Display. The application adapts to any display size – anything from e.g. 11-inch upwards would be fine. Large displays allow measurement of larger visual field areas. In the current application version, the maximum eccentricity is 30 deg at all meridians. A full 30–deg–field with 73 points altogether can be obtained for example with a 27-inch display, if the viewing distance is 20 cm. In this case, a suitable corrective lens is usually needed in front of the eye. If the viewing distance is 40 cm, a 55-inch display would be required for full 30–deg field. With the Fast perimetry and the detection task the 73–point–field can be measured in just 3.5–4 minutes.
Sound signals. The application uses sound signals to indicate the start and end of the measurement and the start of the presentation of each stimulus.
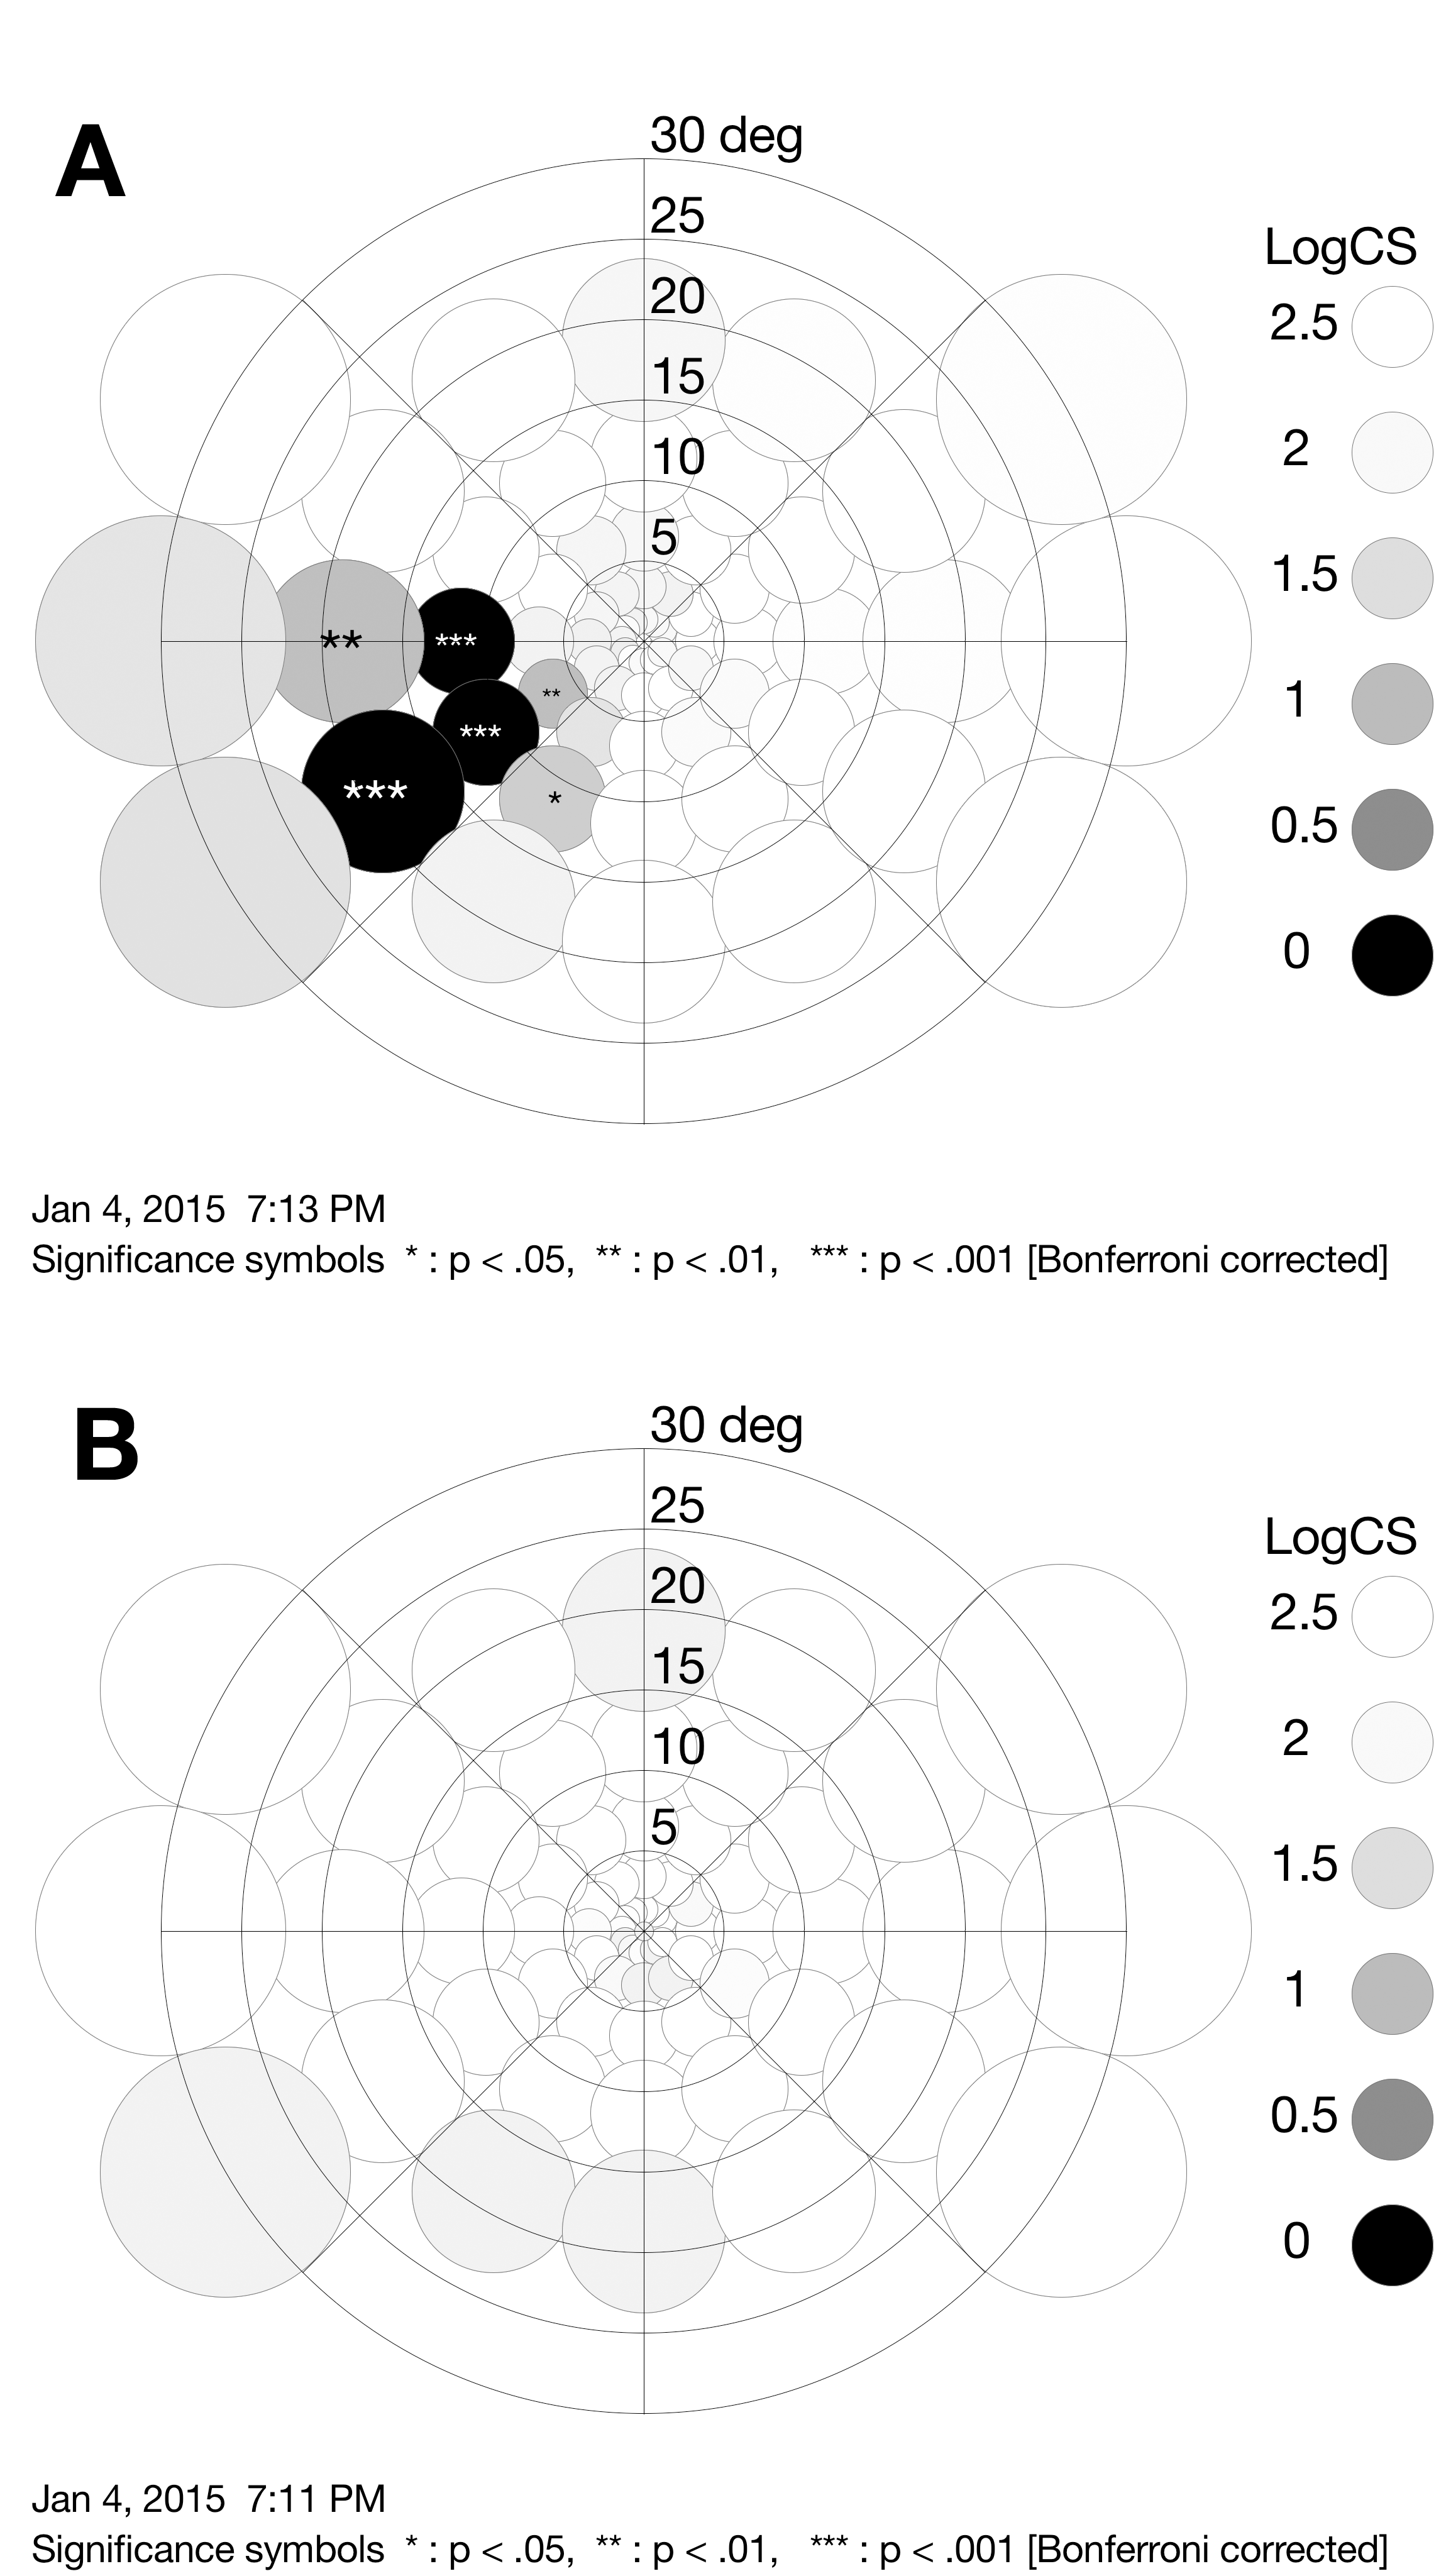
Visual fields of a subject having a cortical V1 lesion (A), and a subject having a healthy visual field (B). These fields were measured with a 30-inch display and a viewing distance of 40 cm.
Letter contrast sensitivity function (LCSF)
Letter contrast sensitivity function for various spatial frequencies can be measured using the same band-pass filtered letters as used in the visual field measurement. The application uses different magnifications of the filtered letters, which correspond to different spatial frequencies. Spatial frequency increases with decreasing letter size. This principle of measuring the contrast sensitivity function was suggested and applied by Näsänen et al. (Environmental Toxicology and Pharmacology, 19, 497-504, 2005). A similar method was presented by Hou et al. (Journal of Vision (2016) 16(6):18, 1–19).
In the LCSF measurement, each stimulus is shown for 512 ms. When the measurement is finished, the application automatically draws the result as a graph. The graphs, as well as alphanumerical results, can be stored to hard drive or cloud.
The application indicates the start of a stimulus by a mid-tone sound. A correct response is followed by a high-tone sound, and a wrong response is followed by a low tone sound.
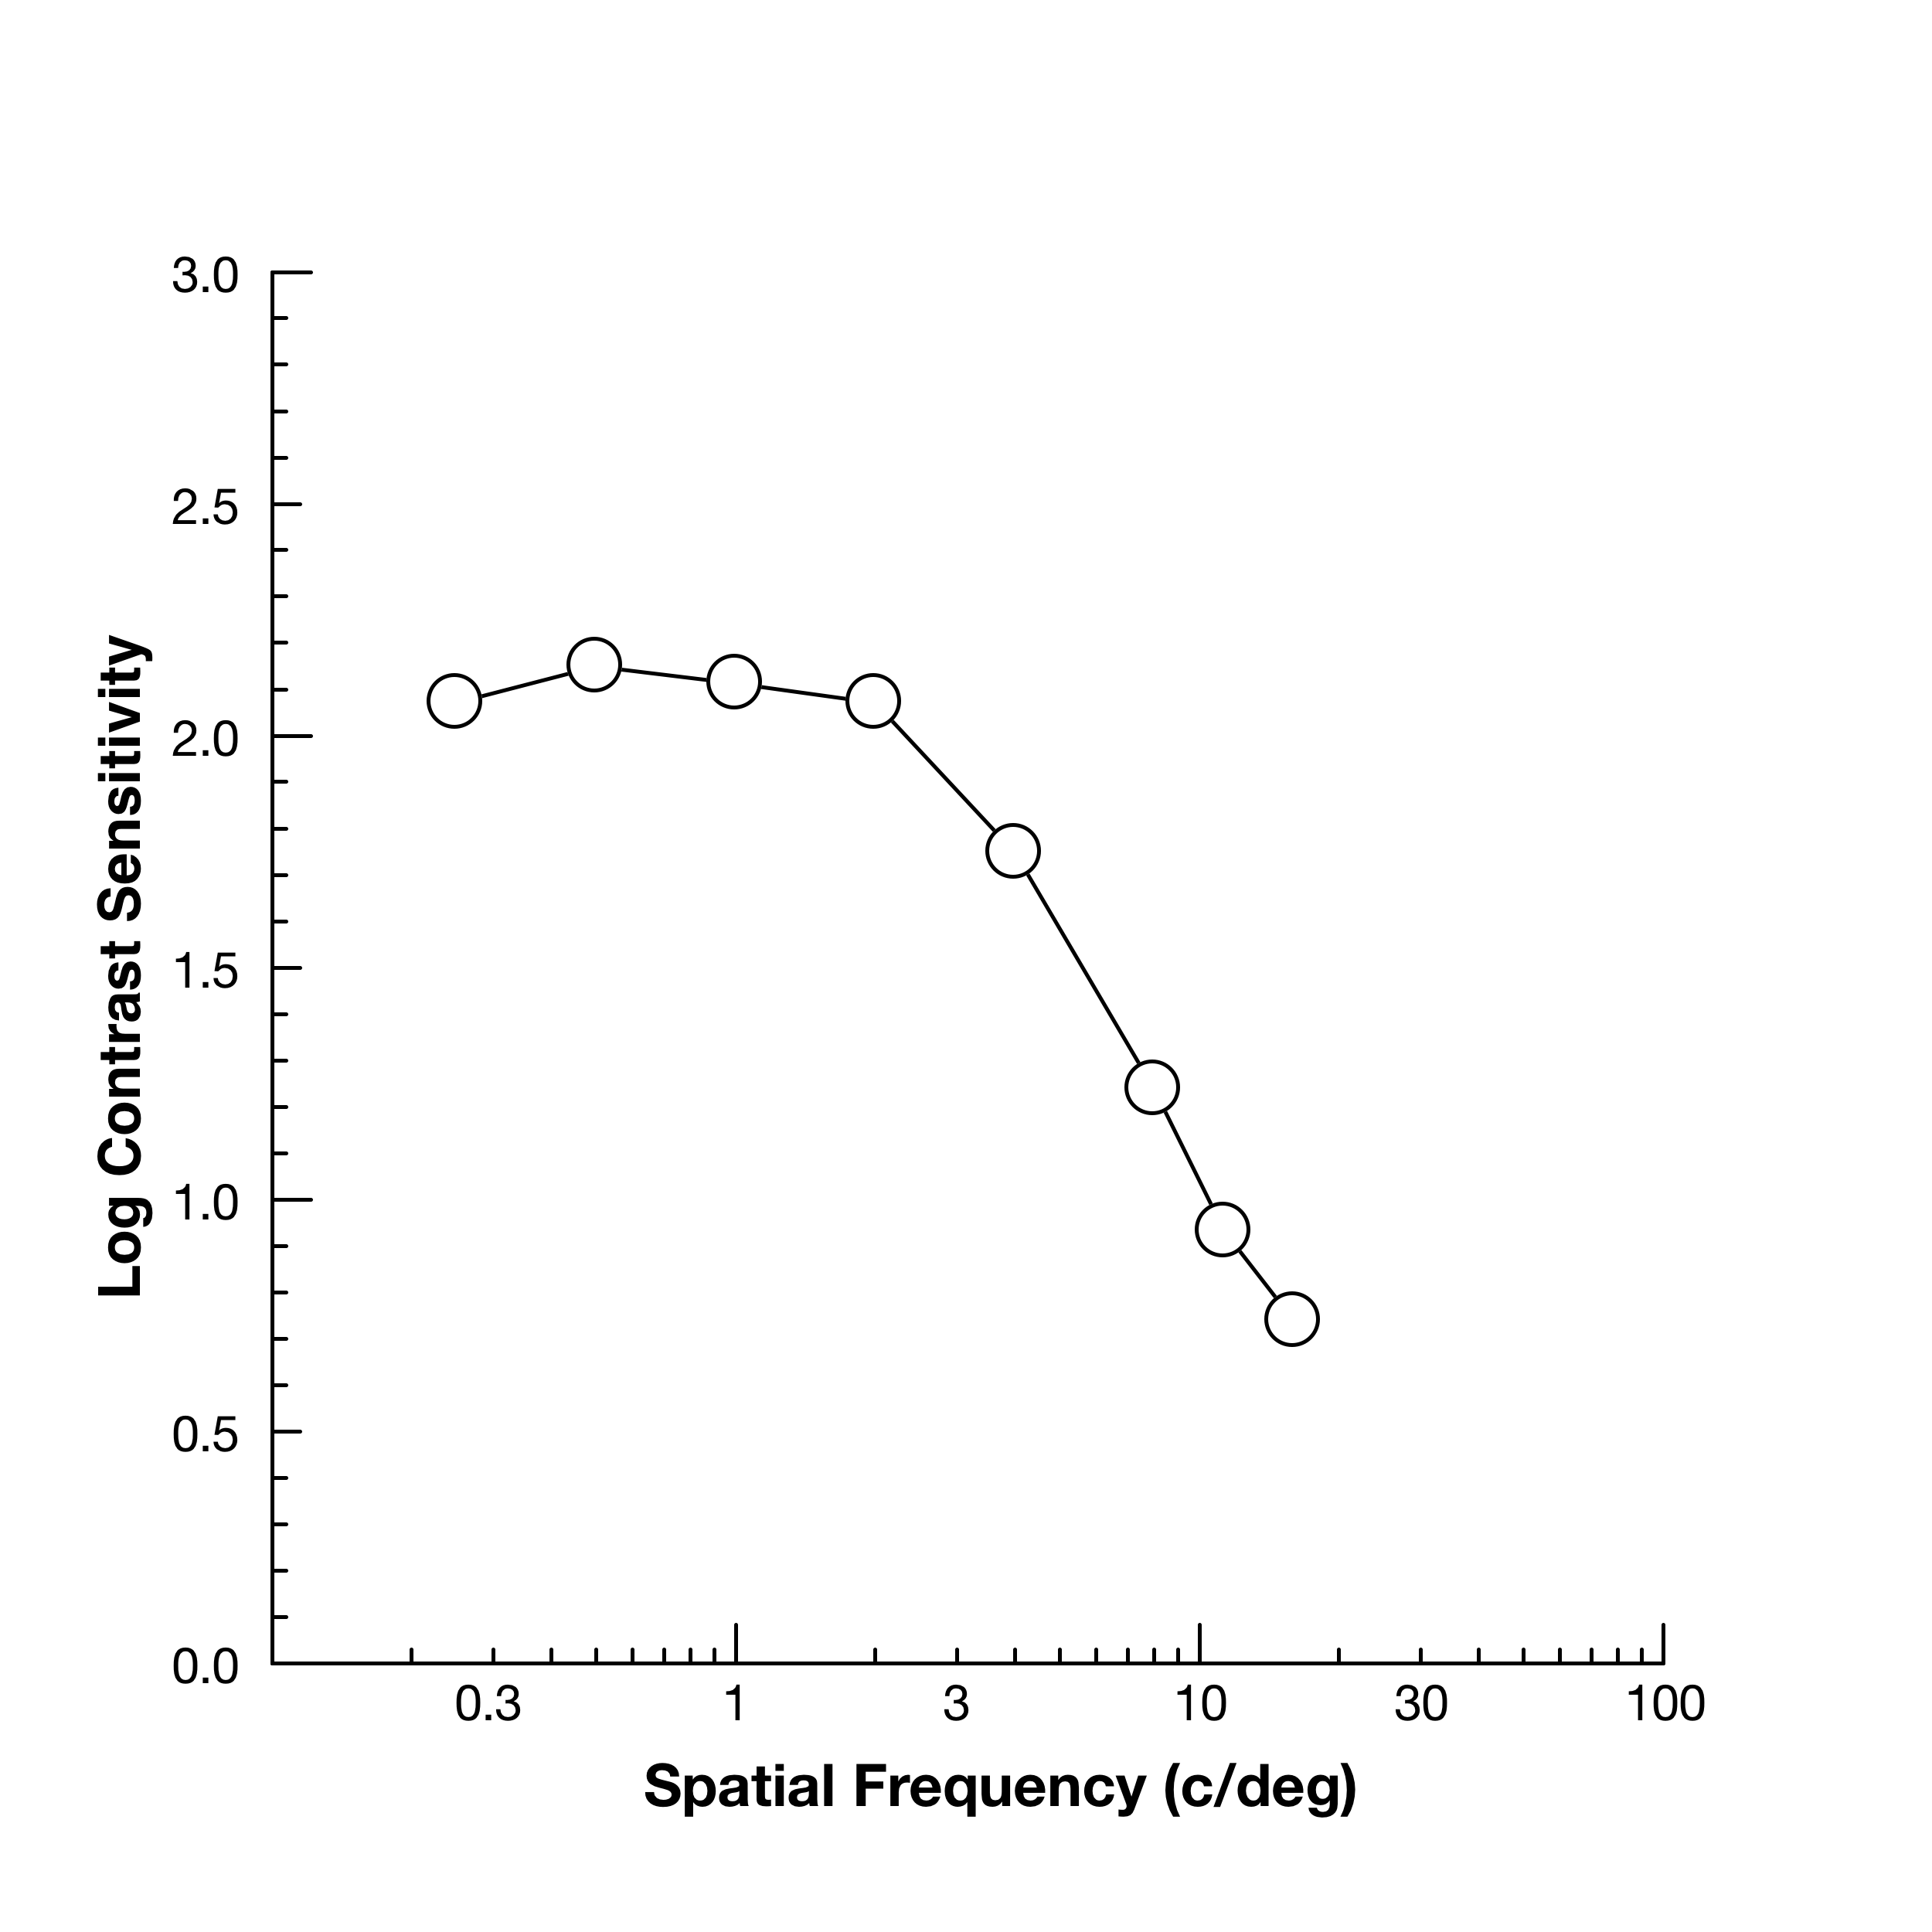
An example of a Letter Contrast Sensitivity Function (LCSF).
Training mode
Some scientific studies suggest that after cortical lesion the function of peripheral vision at defective areas can be improved by intensive training at least in some cases (see e.g. Raninen et al.: 'Temporal sensitivity in hemianopic visual field can be improved by long-term training using flicker stimulation'. JNNP, 2006. http://dx.doi.org/10.1136/jnnp.2006.099366, and Henriksson et al.: 'Training-induced cortical representation of a hemianopic hemifield'. JNNP, 2006. http://dx.doi.org/10.1136/jnnp.2006.099374) .
The 'Training mode' uses methods similar to those that have been found successful in the above-mentioned studies. Vision is trained in defective visual field locations by measuring contrast sensitivity repeatedly for a number of times during weeks or months. However, the effectiveness of the training method has not been generally recognized, and further research is needed on this subject.
The detection task of the training mode is similar to that of detection in perimetry. The task of the observer is to indicate whether she/he has seen a static or flickering ring by pressing the space bar on the keyboard. Observer's response criterion is controlled using catch trials.
Calibration of the display
In order to get accurate results it is important to calibrate the display. The application needs to know the pixel size and the approximate shape of luminance response function of the display, which is characterized by a single number called gamma.
A very quick and easy way to do the calibration is the Visual calibration [Menu: Calibration -> Visual Calibration]. The gamma value obtained in this way is reasonably close to the true value.
Another, but somewhat more laborious, possibility is to use a luminance meter (photometer) to measure the objective luminance values for several display brightness values. Access this option by choosing Calibration->Photometer Calibration Aid. If you choose this, you will have to calculate the gamma value based on the measured luminance values. The gamma and pixel size values are then given to the application by using the Save Calibration menu-item in the Calibration menu, which saves the calibration to the hard disk.
If no calibration is done, the application assumes that the gamma is equal to 2.2 and the pixel size is equal to 0.0275 cm.